
You should spend about 20 minutes on this task
The charts below show the average percentages in typical meals of three types of nutrients, all of which may be unhealthy if eaten too much.
Summarise the information by selecting and reporting the main features, and make comparisons where relevant.
Write at least 150 words.
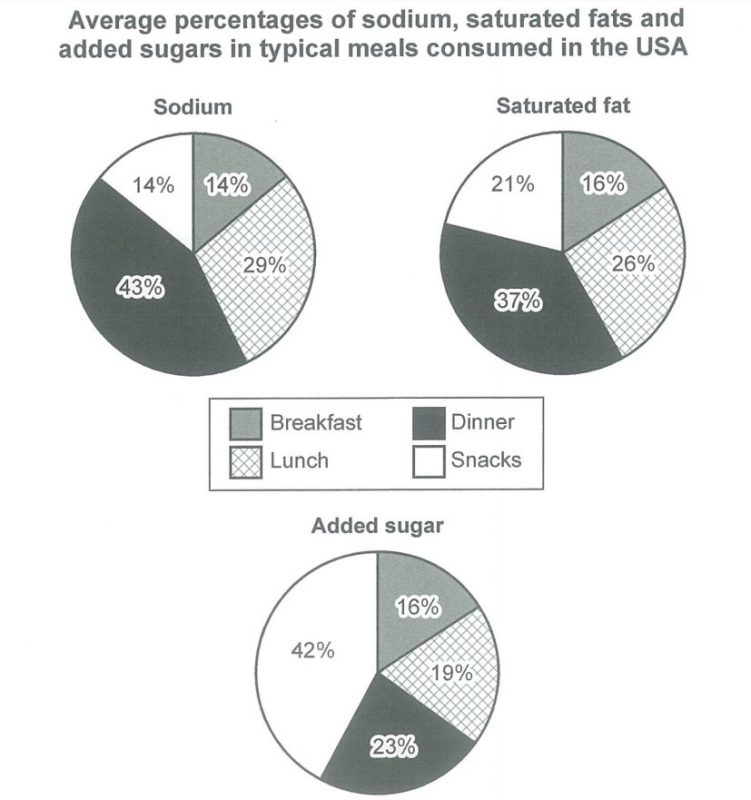
The diagrams illustrate the average proportions of three types of nutrients in typical meals, which can be unhealthy if consumed too much. The three types include sodium, saturated fats and added sugar. The data is taken from the United States of America.
The first chart shows the average percentage of sodium. Dinner contains the most sodium (43%). Breakfast and snackes include an equal proportion of sodium consumed, with each of them adding up to 14% of sodium. Through eating lunch, 29% sodium is consumed. The second chart shows the percentages of saturated fat in meals. By eating dinner, 37% saturated fat is consumed. Lunch contributes to a consumption of 26% saturated fat, followed by snacks with 21% and breakfast with 16%. The last chart illustrates the proportions of added sugar. Snacks contain the highest amount of added sugar (42%). Dinner includes 23% A typical dinner includes 23% addes sugar, while lunch containes 19% and breakfast includes 16%.
All in all, the diagrams show that every typical meal consumed in the USA contains a percentage of at least 14% of nutrients that can be unhealthy if eaten too much.
The chart compares the average percentages of 3 unhealthy nutrients, including sodium, saturated fat and added sugar, in 4 typical meals consumed by American people. Overall, dinner and snacks are unhealthiest meals while breakfast is the healthiest meal.
The levels of sodium and saturated fat in dinner are highest, with 43% of sodium and 37% of saturated fat consumed. The major source of added sugar in typical American diet is snacks when they are associated for 42% of added sugar that American people are eating.
American breakfast is much healthier than those 2 meals as it provides the lowest percentage of 3 types of nutrients, with just around 16% of each. Lunch is less healthy than breakfast, but it is still healthier than snacks and dinner. The percentages of 3 types of nutrients are much higher than that of breakfast but much lower than the data of snack and dinner.
The average proportions of three types of nutrients such as sodium, saturated fats and added sugar in typical American meals are compared in the depicted charts which may be detrimental to health if consumed excessively.
Overall, the charts clearly show that dinner and snacks contain more saturated fats and added sugar compared to breakfast and lunch which make the former meals unhealthier than the latter ones.
The first chart, that presents the average rates of sodium, depicts that dinner contains the highest proportion of sodium (43%) while lunch is in the second position with 29%. Both breakfast and snacks include an equal proportion of sodium (14%) which is the lowest amount for this type of nutrient. The chart showing the rates of saturated fats display nearly the similar account of sodium. Here, dinner contains the maximum and breakfast holds the minimum amount of saturated fats. Lunch has 26% fats but snacks have 5% saturated fats less than lunch. In the third chart, snacks offer quite a contradictory picture as they contribute to the consumption of 42% added sugar which makes this type of meal the most vulnerable. Additionally, the Americans consume 23% added sugar by taking their dinner which is 4% higher than lunch and 6% more than breakfast.
The pie charts give nutritional information regarding three types of potentially unhealthy ingredients for different meals. Overall, dinner accounted for the highest levels of salt and saturated fat, whereas snacks accounted for the highest levels of sugar that was added.
Salt and saturated fat consumption followed similar patterns. Dinner accounted for 43% and 37%, respectively. This was followed by lunch with 29% sodium and 26% fat. Levels of sodium were the same for breakfast and snacks at 14%. Fat was significantly higher for snacks at 21% than it was for breakfast (16%).
Added sugar had roughly opposite consumption patterns. Forty-two percent of the sugar was consumed from snacks. The next highest was dinner at 23% and lunch at 19%. Breakfast accounted for the lowest percentage at only 16%.
Overall, dinner accounted for the highest levels of salt and saturated fat, whereas snacks accounted for the highest levels of sugar that was added.
As can be seen from the information above, most sodium and saturated fats were consumed for dinner, while for sugar it was snacks.